Technical Analysis Basics for Beginners

Key takeaways
- Technical analysis (TA) is the study of past price and volume on charts to help make trading decisions. It looks at how a price has moved, not at the project behind it.
- The core building blocks are candlesticks, trends, support and resistance, and volume. A few simple tools, like moving averages and RSI, build on top of these.
- TA is a tool, not a crystal ball. It describes what price has done and hints at what might happen next, but it does not predict the future.
- Patterns and signals fail often. Markets move on news and sentiment, so no chart pattern or indicator is a guarantee.
- Use TA alongside your own research and risk management. Never trade more than you can afford to lose.
Open any trading app and you will see a price chart covered in coloured bars, lines, and numbers. That chart is the home of technical analysis, often shortened to TA. It is one of the most talked-about topics in crypto, and also one of the most misunderstood.
This guide explains what technical analysis is in plain English, walks through its main building blocks, and shows a few simple tools beginners hear about. Just as importantly, it is honest about the limits: TA can be useful, but it is often wrong, and it is not a shortcut to guaranteed profit.
Who this guide is for:
- Beginners who keep hearing terms like "support," "RSI," or "trend" and want them explained simply.
- Anyone curious whether reading charts can help them make decisions.
- People who want a realistic, safety-first view of what TA can and cannot do.
Never looked closely at a chart before? Start with our guide to how to read a candlestick chart, then come back here.
What is technical analysis (TA)?
Technical analysis is the practice of studying past price and trading volume on a chart to make decisions about what to do next. Volume simply means how much of an asset was traded in a period. The core idea is that a price chart records the actions of every buyer and seller, so patterns in that history may offer clues about the future.
TA is usually contrasted with fundamental analysis. Fundamental analysis looks at the value behind an asset, for example a crypto project's technology, team, real-world use, or a company's earnings. Technical analysis largely ignores those details and focuses on the price action itself, asking questions like "Is the price rising or falling?" and "Where has it stalled before?"
Neither approach is "correct." They answer different questions. Fundamentals ask what to buy and why; technicals ask more about when and at what price. Many traders glance at both, and even then they can still be wrong.
Simple analogy: think of a chart like a weather forecast. It uses past patterns to estimate what is likely next. It is sometimes helpful, but rain still falls on days the forecast said it would not.
Core building blocks
Before any fancy tools, TA rests on a few simple ideas. Learn these four and most charts start to make sense.

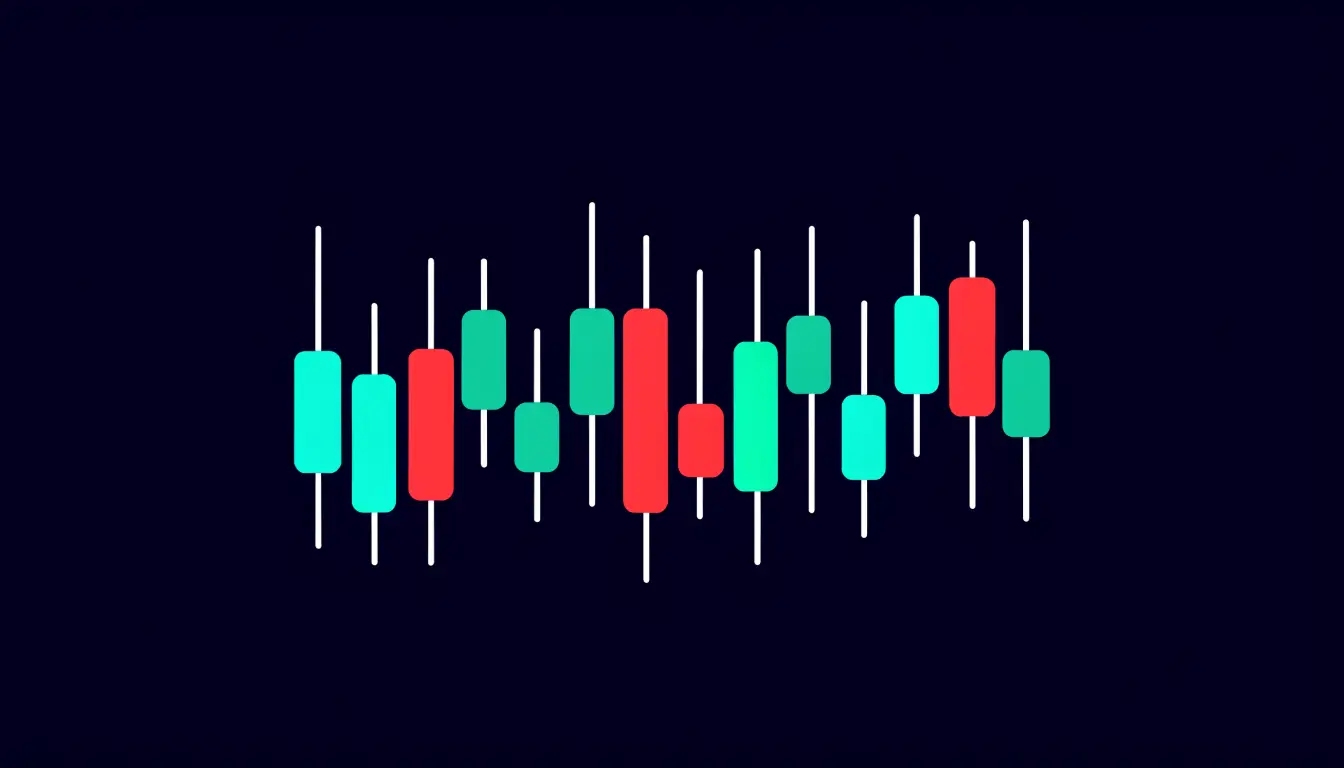
- Candlesticks. Each "candle" shows the open, close, high, and low price for a period, such as one hour or one day. A row of candles shows how price moved over time. Learn to read them in our guide to how to read a candlestick chart.
- Trends. A trend is the general direction of the price: up, down, or sideways. Spotting the trend is often the first thing a chart reader does.
- Support and resistance. These are price levels where the market has repeatedly stopped and turned. Support is a floor buyers tend to step in at; resistance is a ceiling sellers tend to step in at.
- Volume. Volume shows how many units were traded. A price move on high volume is often seen as more meaningful than the same move on low volume.
Everything else in technical analysis is really just a different way of measuring or drawing these same basics. It also helps to understand why prices swing so much in the first place, which we cover in what is crypto volatility.
Common tools and indicators (kept simple)
Traders add indicators to a chart to summarise price action in a single line or number. An indicator is just a calculation based on price and volume. Here are three you will hear about most, explained by what they try to show, not how to trade them.

- Moving averages. A moving average smooths out the price into a single line by averaging it over a set number of periods, such as the last 50 days. It tries to show the underlying direction by hiding the day-to-day noise. When price is above a rising average, some read that as an uptrend; the reverse for a downtrend.
- RSI (Relative Strength Index). RSI is a number between 0 and 100 that tries to show whether recent moves have been unusually strong. Readings near the top are often called "overbought" and near the bottom "oversold." These are hints about momentum, not signals that a price must reverse.
- Trendlines. A trendline is a straight line you draw yourself to connect a series of highs or lows. It tries to make the current trend and its likely support or resistance easier to see.
There are hundreds more indicators, but new tools do not make you more accurate. A crowded chart can hide the simple picture. Understanding your crypto order types matters far more than adding a tenth indicator.
Support, resistance, and trends
Two ideas do most of the heavy lifting in beginner TA: levels (support and resistance) and direction (trends). Here they are in plain terms.
Support is a price level where buyers have stepped in before and pushed the price back up. Think of it as a floor. Resistance is a level where sellers have stepped in and pushed the price back down. Think of it as a ceiling. These are not exact prices set in stone; they are zones where the market has reacted in the past. When a price finally pushes through resistance, that old ceiling can start acting as a new floor, and vice versa.
A trend is the overall direction of price over time. There are three:
- Uptrend: the price makes higher highs and higher lows overall. The general path is upward.
- Downtrend: the price makes lower highs and lower lows. The general path is downward.
- Sideways (or "ranging"): the price bounces between roughly the same support and resistance without a clear direction.
The catch is that trends and levels are only obvious after the fact. In the moment, it is never certain whether a level will hold or a trend will continue. That uncertainty is exactly why the next section matters so much.
The limits of TA (important)
This is the part most beginners skip, and it is the most important. Technical analysis is a helpful way to organise information, but it has real and serious limits.
- Patterns can fail. A "textbook" pattern can appear and then do the exact opposite. There is no shape on a chart that works every time.
- It is not prediction. TA describes the past and estimates probabilities at best. It cannot tell you what will happen next.
- Markets move on news and sentiment. A single announcement, hack, regulation, or wave of fear or greed can override any chart pattern in seconds.
- Over-reliance is dangerous. Treating a chart as certainty leads people to risk too much on a single "sure thing." There are no sure things.
- No indicator is a guarantee. RSI, moving averages, and the rest are hints, not promises. Different traders read the same chart in opposite ways.
Warning: Technical analysis is one tool among many, and it is often wrong. It does not predict the future and it is not financial advice. Never trade more than you can afford to lose, and pair any TA with a plan for when you are wrong. Start with our guide to risk management for beginners.
Tips and common mistakes
Helpful tips
- Start simple. Learn candlesticks, trend, and support and resistance well before adding indicators.
- Use TA as one input. Combine it with your own research into the project and the wider market, not on its own.
- Always plan for being wrong. Decide in advance how much you could lose on any idea, and stick to it.
- Practise without risk first. Study charts, or use a demo, before putting real money on the line. Learn the difference between spot and futures trading so you understand the risk you are taking.
Common mistakes to avoid
- Treating TA as certainty. A pattern is a maybe, never a promise. Betting big because a chart "looks bullish" is how people get hurt.
- Ignoring risk management. No chart skill saves you if a single bad trade can wipe you out.
- Piling on indicators. More lines do not mean more accuracy; they usually mean more confusion.
- Only seeing what you want. It is easy to spot the patterns that support a decision you already made and ignore the rest.
Frequently asked questions
What is technical analysis?
Technical analysis is the study of past price and volume on a chart to help make trading decisions. It focuses on how a price has moved rather than the project or company behind it.
Does technical analysis work?
It can help you organise information and spot levels and trends, but it is often wrong and does not predict the future. It is one tool among many, not a guarantee of profit, and should be used with research and risk management.
What is support and resistance?
Support is a price level where buyers have repeatedly stepped in, acting like a floor. Resistance is a level where sellers have repeatedly stepped in, acting like a ceiling. They are zones the market has reacted to before, not exact or permanent prices.
What is RSI?
RSI, or the Relative Strength Index, is an indicator that scores recent price momentum on a scale of 0 to 100. High readings are called "overbought" and low ones "oversold," but these are hints about momentum, not signals that a price must reverse.
Is TA better than fundamentals?
Neither is better; they answer different questions. Fundamental analysis looks at the value behind an asset, while technical analysis looks at price action. Many people glance at both, and even then they can still be wrong.
Summary
Technical analysis is the study of past price and volume on charts. Its core building blocks are candlesticks, trends, support and resistance, and volume, with tools like moving averages and RSI built on top. Used carefully, it can help you make sense of a chart. But it is a tool, not a crystal ball. It fails often, it does not predict the future, and no indicator is a guarantee. Pair it with real research, sensible risk management, and money you can afford to lose.
Next step: ready to read a chart for yourself? Work through our beginner walkthrough on how to read a candlestick chart.